Distortion Product Otoacoustic Emission/DPOAE
|
|
Purpose
DPOAE, Distortion Product Otoacoustic Emissions measures the response of the outer hair cells
DPOAE Testing Parameters
Materials
DPOAE measurement tool such as Scout, Capella or Corti
Procedures/Instruction
There are several parameters that can often be adjusted when performing DPOAE testing. The choice of parameters used will depend on the purpose of DPOAE testing and the conditions under which the test is occurring. One such parameter is the range of frequencies tested. DPOAEs can be elicited across a range of frequencies and the reason for testing can provide rationale for the range of frequencies tested. For example, in the case of a patient who is being tested to assess the effects of ototoxic medications on the auditory system, very high-frequency DPOAE evaluation may be used to understand effects of ototoxic medications early in the course of treatment. In the case of a young child who is having a cross check of behavioral hearing responses, the frequency range tested my be limited to a more standard audiometric range.
Another variable that may be manipulated with some equipment is the number of test points per octave that are assessed. This measure dictates how fine-tuned the measurements are within an octave band. The more measurements that are made within an octave band, the more frequency specific information can be obtained. As with the range of frequencies, the choice of the number of test points per octave is made depending on the purposes of testing. In some cases, a highly precise frequency location of dysfunction may provide useful information for diagnosis or treatment.
As described previously, the frequency and intensity ratios most typically used for eliciting DPOAEs in clinical practice are chosen to provide the most robust cubic difference distortion product across the frequencies most typically tested. However, there may be specific circumstances in which the frequency or intensity ratio should be altered, and some equipment provides opportunity to adjust these parameters.
Capella
- Open Noah
- Select Otometrics
- Select DPOAE measurement
- Perform twice for each ear, fully removing the tip each time
- Ask patient to be still and refrain from moving or talking
- Turn on Unit
- Select Frequency Range of DPOAE
- Stimulate to record DPOAE
- Perform twice for each ear, fully removing the tip each time
- Ask patient to be still and refrain from moving or talking
- Open Scout Program
- Enter patient information
- Select DPOAE test range (12 Frequency)
- Stimulate to record DPOAE
- Perform twice for each ear, fully removing the tip each time
- Ask patient to be still and refrain from moving or talking
Interpretation/SOL
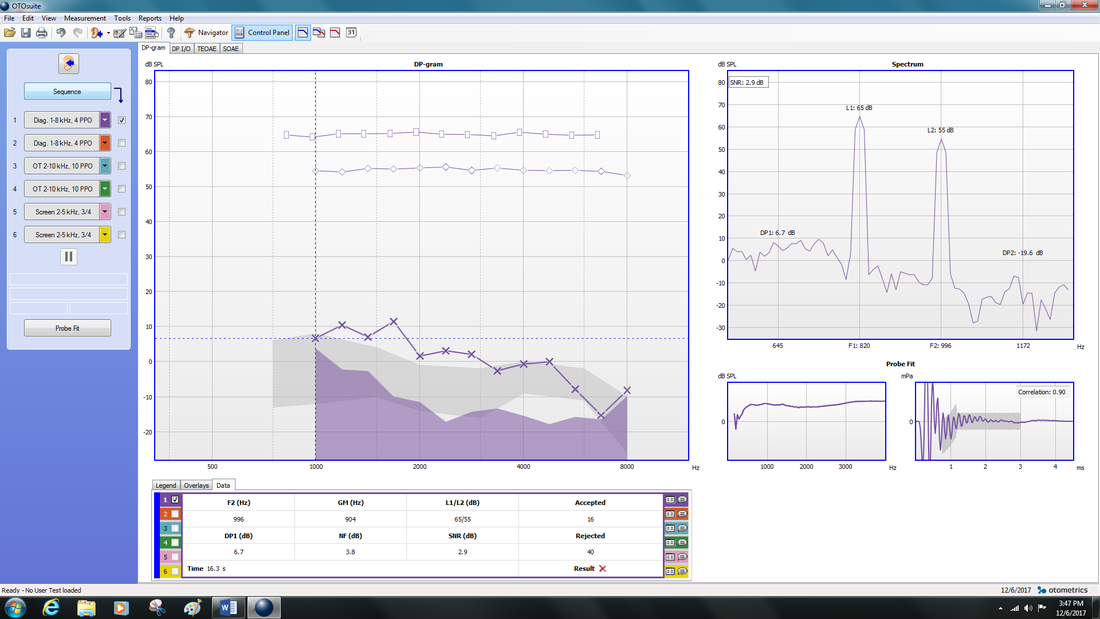
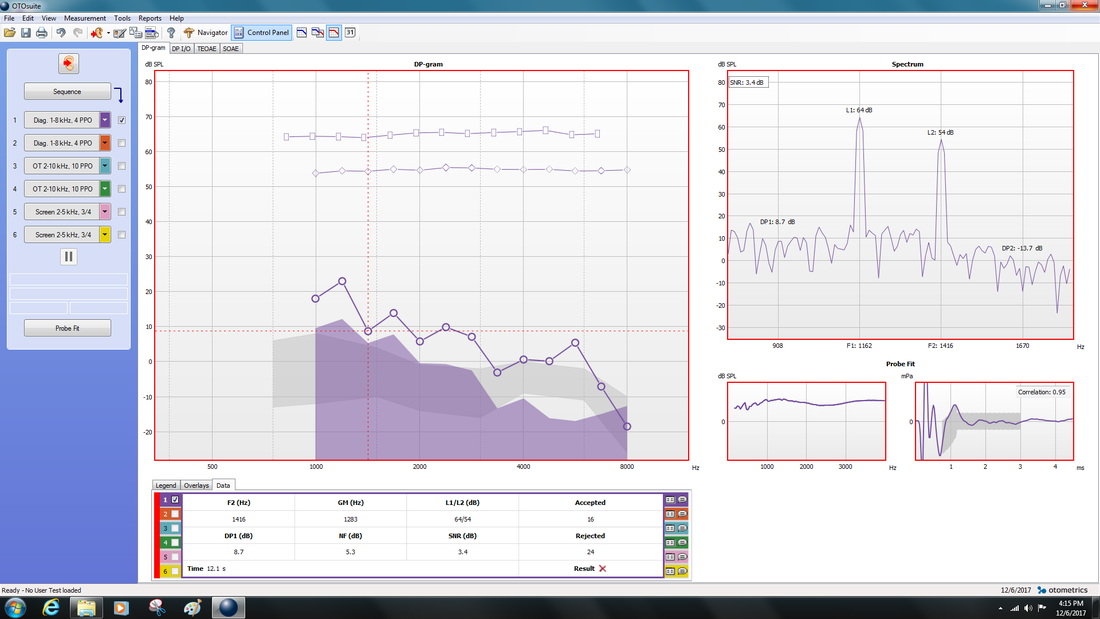
A very rough guideline would be a difference between the DPOAE and the noise floor of 6dB.
DPOAE recordings are commonly displayed using a table of values and a DP-gram, which is a graphical display of the intensity of the sound measured in the ear canal as a function of frequency. The DP-gram typically includes the intensity of f1, the intensity of f2, the intensity of the frequency of the cubic difference distortion product, and the intensity of predetermined frequencies present in the recording that are used to estimate the noise floor. The intensities of f1 and f2 are used to determine whether the signals intended to evoke the DPOAE were delivered at the correct frequency and intensities. The levels of the DPOAE and the noise floor levels are used to determine whether the DPOAE of interest is present. The DPOAE must be sufficiently intense to be considered a potential DPOAE and must be sufficiently higher than the noise floor to be considered to be present and not just a signal occuring randomly in the background noise. The particular levels that allow a clinician to make that judgement depend on the normative data for the equipment and clinical population of interest.
DPOAE recordings are commonly displayed using a table of values and a DP-gram, which is a graphical display of the intensity of the sound measured in the ear canal as a function of frequency. The DP-gram typically includes the intensity of f1, the intensity of f2, the intensity of the frequency of the cubic difference distortion product, and the intensity of predetermined frequencies present in the recording that are used to estimate the noise floor. The intensities of f1 and f2 are used to determine whether the signals intended to evoke the DPOAE were delivered at the correct frequency and intensities. The levels of the DPOAE and the noise floor levels are used to determine whether the DPOAE of interest is present. The DPOAE must be sufficiently intense to be considered a potential DPOAE and must be sufficiently higher than the noise floor to be considered to be present and not just a signal occuring randomly in the background noise. The particular levels that allow a clinician to make that judgement depend on the normative data for the equipment and clinical population of interest.
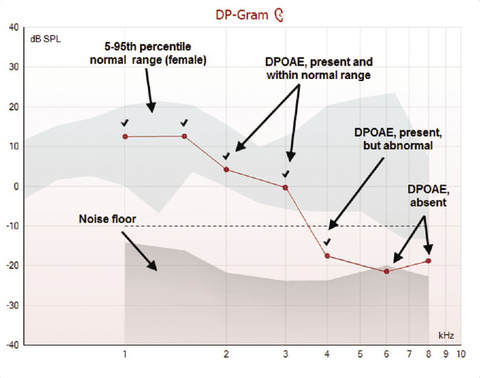
This is a graph used to plot absolute DPOAE amplitude to obtain information regarding audiometric thresholds. Depending on the amplitude of the response, hearing can be determined to fall into the normal range, the abnormal range, or a borderline range. It is frequency specific between 750-8000Hz. the shaded area represents DPOAE levels for the 5th percentile of normal hearing patients (bottom) and the 90th percentile of hearing impaired patients (top).
DPOAE results are expected to be present when pure tone thresholds are less than 25 dBHL and are expected to be absent when pure tone thresholds are greater than 40 dB HL. DPOAE results are found in essentially all normal ears and are typically absent when there is a sensorineural loss off ~50 - 60 dB HL.
DPOAE results are expected to be present when pure tone thresholds are less than 25 dBHL and are expected to be absent when pure tone thresholds are greater than 40 dB HL. DPOAE results are found in essentially all normal ears and are typically absent when there is a sensorineural loss off ~50 - 60 dB HL.
Management
References
Gelfand, Stanley A. Essentials of Audiology. Thieme, 2016.
DeRuiter, Mark, and Virginia Ramachandran. Basic Audiometry Learning Manual. Plural Publishing Inc., 2017
DeRuiter, Mark, and Virginia Ramachandran. Basic Audiometry Learning Manual. Plural Publishing Inc., 2017